Pharmacokinetics & Dosing Concepts
Steady State
Steady state is the condition in which the amount of drug entering the body over a dosing interval equals the amount eliminated, so concentrations repeat from interval to interval instead of climbing.
Steady state arrives when input and output balance across a dosing interval and the concentration curve stops rising from one interval to the next. The approach is exponential and depends on one thing only, the half-life: about half the eventual plateau after one half-life, three quarters after two, and roughly 94 to 97 percent after four or five. Dose size and dosing interval set how high the plateau sits and how much it fluctuates; neither changes how long it takes to get there.
For a weekly agent with a half-life near a week, that arithmetic puts steady state four to five weeks after starting, which is what the semaglutide labelling states. A daily agent with a 13-hour half-life is there inside three days. The escalation schedules used in the STEP and SURMOUNT trials run far longer than either, over months rather than weeks, which is about as clear a demonstration as exists that titration addresses tolerability rather than pharmacokinetics.
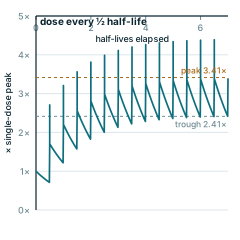
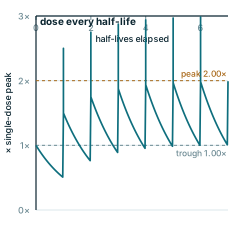
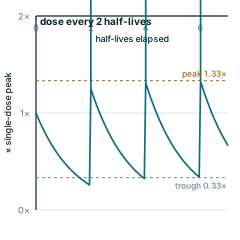
Steady state defines when exposure comparisons are legitimate. Trough samples drawn before it understate exposure, and any dose change resets the clock, requiring another four to five half-lives before the new plateau is established. It is also the reference point for accumulation, since the ratio between steady-state and first-dose exposure follows directly from the interval-to-half-life ratio.
The habitual error is treating pharmacokinetic steady state as though the clinical picture had settled too. Plasma exposure plateaus in weeks while weight, glycaemia and receptor responsiveness keep changing for a year or more, so a still-improving response is not evidence that concentrations are still climbing. Adverse effects that fade over months fade through adaptation, not through falling concentrations.
Worked examples — accumulation to steady state
Repeat doses are summed by superposition: every dose still in the body keeps decaying while the next one lands. Peak and trough have closed forms — 1/(1−e^(−kτ)) and that value times e^(−kτ) — so the plateau height is set entirely by the dosing interval relative to the half-life.
Every panel is redrawn from its own equation by scripts/glossary-figures.js — no traced or stock artwork, and a rebuild is byte-identical.