Pharmacokinetics & Dosing Concepts
Trough Concentration (Cmin)
Trough concentration is the lowest level within a dosing interval, sampled immediately before the next dose, and a stable predose trough is the practical signal that steady state has arrived.
The trough is the minimum concentration within a dosing interval, and in practice it means the sample drawn immediately before the next dose rather than the true mathematical minimum. It is the most reproducible point on the whole curve, because concentrations change slowly during the terminal phase and quickly around the peak, so a small timing error near the trough costs little accuracy while the same error near Cmax costs a great deal.
That reproducibility gives it several jobs. Successive predose troughs that stop rising are the standard operational evidence that steady state has arrived. Vancomycin and the aminoglycosides were monitored on trough levels for decades. In peptide and biologic development, immunogenicity samples are drawn at trough because circulating drug interferes with anti-drug antibody assays, and the trough is when the least of it is present.
Clinically the trough is where loss of effect appears, so it is the concentration to examine when a patient reports the effect fading before the next dose is due. It is also the number most sensitive to the interval-to-half-life ratio: lengthening the interval past a few half-lives drives the trough toward zero while leaving the peak largely intact, converting steady exposure into intermittent exposure.
A sample taken after the next dose has been given is not a trough, and that contaminates more datasets than any subtlety of pharmacokinetics. The interpretive error is treating an undetectable trough as failed therapy. For compounds whose effect outlasts their presence, through slow receptor dissociation or a downstream change that persists for days, an unmeasurable trough is entirely compatible with full effect.
Worked examples — accumulation to steady state
Repeat doses are summed by superposition: every dose still in the body keeps decaying while the next one lands. Peak and trough have closed forms — 1/(1−e^(−kτ)) and that value times e^(−kτ) — so the plateau height is set entirely by the dosing interval relative to the half-life.
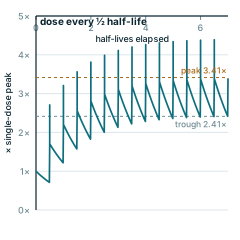
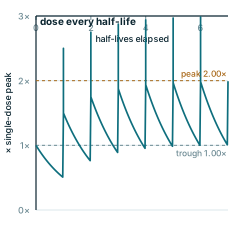
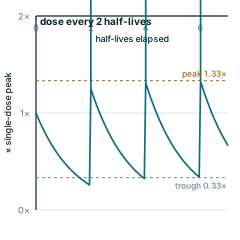
Every panel is redrawn from its own equation by scripts/glossary-figures.js — no traced or stock artwork, and a rebuild is byte-identical.