Pharmacokinetics & Dosing Concepts
Peak-to-Trough Ratio
The peak-to-trough ratio is steady-state Cmax divided by Cmin, a measure of how far concentration swings within a dosing interval and therefore how flat a regimen really is.
Peak-to-trough ratio compares the highest and lowest concentrations within one dosing interval at steady state; the related fluctuation index divides the difference between them by the average concentration. Both are governed by a single relationship, the ratio of the dosing interval to the half-life. Dose once per half-life and concentration halves between doses, a twofold swing. Stretch the interval to several half-lives and the trough approaches zero while the peak barely moves.
Insulin makes the comparison concrete. Neutral protamine Hagedorn insulin produces a pronounced peak some hours after injection, whereas degludec, released slowly from a subcutaneous multihexamer depot, is close to peakless across a day. The same logic sorts the incretins: a daily agent with a half-life around 13 hours fluctuates visibly within each day, while a weekly agent with a half-life near a week is comparatively flat once it reaches steady state.
Flatness is worth paying for when effective and toxic concentrations sit close together, or when adverse effects follow the peak and loss of effect follows the trough. It is achieved by shortening the interval, slowing absorption, or extending the half-life, and only the first is available once a product exists. Fluctuation is also what distinguishes two regimens delivering identical total exposure.
Flat is not automatically better, and that is where the number gets misused. Several peptide systems require pulses: gonadotropin-releasing hormone suppresses the axis it stimulates when delivered continuously instead of episodically, and growth hormone secretion is physiologically pulsatile. A ratio calculated before steady state is meaningless as well, since the trough is still climbing toward its plateau.
Worked examples — accumulation to steady state
Repeat doses are summed by superposition: every dose still in the body keeps decaying while the next one lands. Peak and trough have closed forms — 1/(1−e^(−kτ)) and that value times e^(−kτ) — so the plateau height is set entirely by the dosing interval relative to the half-life.
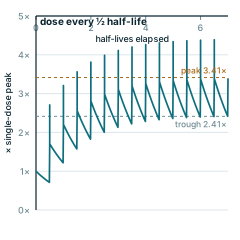
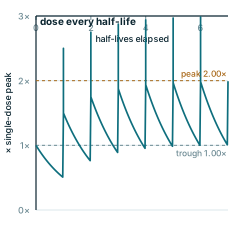
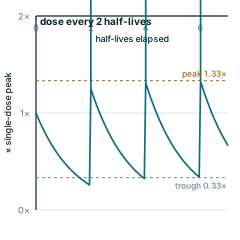
Every panel is redrawn from its own equation by scripts/glossary-figures.js — no traced or stock artwork, and a rebuild is byte-identical.