Pharmacokinetics & Dosing Concepts
Peak Plasma Concentration (Cmax)
Cmax is the highest plasma concentration observed after a dose, an experimental value reflecting absorption rate as well as dose, and it drives concentration-related adverse effects.
Peak plasma concentration is the largest measured value on a concentration-time curve, and measured is doing the work in that sentence: Cmax is read off the samples actually drawn, not fitted from a model. Its size depends on the dose, the fraction absorbed, how fast absorption happens relative to elimination, and the volume the drug distributes into. Paired with the area under the curve, it separates the rate of absorption from the extent of it.
Regulators treat it as one of two primary quantities. A bioequivalence claim requires the 90 percent confidence interval for the ratio of test to reference geometric means to fall within 80 to 125 percent for both Cmax and area under the curve, so a product can fail on peak alone while delivering identical total exposure. Oral semaglutide, absorbed across the gastric mucosa with the permeation enhancer SNAC, has bioavailability around one percent and a correspondingly variable peak.
Cmax is the number that matters when harm tracks concentration rather than cumulative exposure. Reformulation that flattens the peak while preserving the area is the standard response to peak-related intolerance, and it changes no active ingredient. Conversely, where effect is driven by cumulative exposure, a lower peak with the same area changes nothing worth having.
The commonest defect is invisible on a spec sheet: a sparse sampling schedule that misses the true peak and reports a value too low, which is why Cmax values from studies with different sampling grids should not be compared. The second is quoting a rodent Cmax as though it described human exposure, when body-weight-scaled doses in mice routinely reach concentrations no human regimen approaches.
Worked examples — absorption shapes
All three solve the Bateman function, C(t) ∝ e^(−ke·t) − e^(−ka·t), and differ only in the ratio of absorption to elimination rate. Tmax is not a property you choose; it falls out as ln(ka/ke)/(ka−ke). The shaded area is AUC, the exposure the body actually sees.
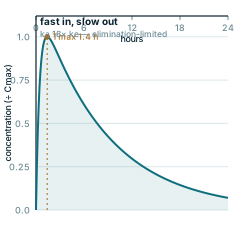
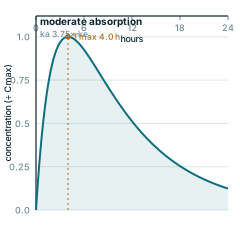
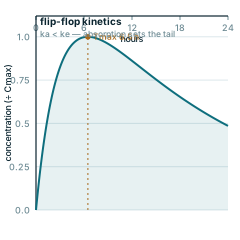
Every panel is redrawn from its own equation by scripts/glossary-figures.js — no traced or stock artwork, and a rebuild is byte-identical.