Pharmacokinetics & Dosing Concepts
Time to Peak Concentration (Tmax)
Tmax is the observed time at which plasma concentration peaks after a dose, a marker of absorption rate fixed by the balance between the absorption and elimination rate constants.
Time to peak concentration is the sampling time at which the highest concentration was observed. Like Cmax it is nonparametric, so it can only take values at which a sample was actually drawn. In a first-order absorption model it is determined entirely by the two rate constants, arriving at the natural logarithm of their ratio divided by their difference, which makes it independent of dose in a linear system: doubling the dose doubles the peak but does not move the time it occurs.
Route and formulation dominate the number. Subcutaneous liraglutide peaks around 8 to 12 hours after injection; subcutaneous semaglutide peaks between one and three days, reflecting slow absorption from the depot more than anything else. Oral semaglutide behaves quite differently, absorbed rapidly across the gastric mucosa with a permeation enhancer and peaking within about an hour before falling away, which is why its administration conditions are specified so tightly.
As a rate marker Tmax complements the area under the curve, which reports extent only. Two formulations with identical exposure and different Tmax values differ in how fast they act and how sharply they peak, and in bioequivalence assessment Tmax is compared where rapid onset matters clinically. Because it is set by absorption relative to elimination, a change in clearance alone can shift it without any change in the formulation.
Comparing Tmax across studies with different sampling schedules is the standard error; a study sampling every four hours cannot report a two-hour peak. The other is reading Tmax as time to onset of effect. Gastric emptying slows within a single GLP-1 dose, well before the plasma peak, while weight loss accrues over months, so the effect timeline belongs to pharmacodynamics, not to the moment the curve turned over.
Worked examples — absorption shapes
All three solve the Bateman function, C(t) ∝ e^(−ke·t) − e^(−ka·t), and differ only in the ratio of absorption to elimination rate. Tmax is not a property you choose; it falls out as ln(ka/ke)/(ka−ke). The shaded area is AUC, the exposure the body actually sees.
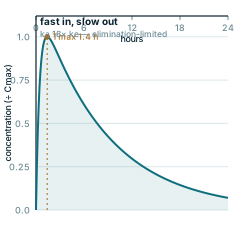
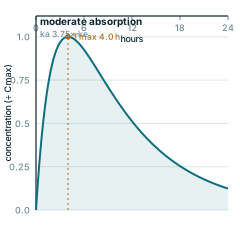
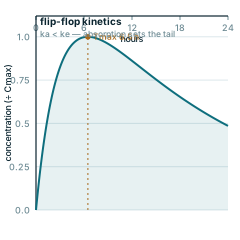
Every panel is redrawn from its own equation by scripts/glossary-figures.js — no traced or stock artwork, and a rebuild is byte-identical.