Pharmacokinetics & Dosing Concepts
Area Under the Curve (AUC)
Area under the concentration-time curve is the integral of plasma concentration over time, the standard single-number measure of how much drug exposure a dose actually delivered.
Area under the curve is what it sounds like: plot concentration against time and integrate. The units are concentration multiplied by time, typically nanogram-hours per millilitre, and the value is usually computed from sampled points by the trapezoidal rule rather than from a formula. Two versions are reported. Exposure up to the last measurable sample is the observed quantity; exposure extrapolated to infinity adds a tail estimated from the terminal slope. The governing relationship is simple and worth memorising: exposure equals the bioavailable fraction of the dose divided by clearance.
That identity makes area under the curve the currency of regulatory comparison. Bioequivalence between a generic and its reference product is judged by showing that the ninety percent confidence interval for the ratio of geometric means, for both exposure and peak concentration, falls inside eighty to one hundred and twenty-five percent. Exposure is likewise the input axis for most exposure-response analyses.
Using exposure rather than a single concentration changes conclusions. Two formulations can share an identical area while differing entirely in shape, one peaking sharply and one flat, which is exactly the distinction that separates a tolerability problem from an efficacy one. Where an effect depends on cumulative exposure, area is the right predictor; where it depends on exceeding a threshold, it is the wrong one.
The number gets abused in two familiar ways. Truncated exposure is quoted as though it were total, when a large extrapolated tail signals that sampling stopped too early to characterise elimination. And cross-compound comparisons are made per milligram, as though a bigger area meant a stronger drug, when area reflects clearance and bioavailability at least as much as intrinsic activity and says nothing at all about receptor potency.
Worked examples — absorption shapes
All three solve the Bateman function, C(t) ∝ e^(−ke·t) − e^(−ka·t), and differ only in the ratio of absorption to elimination rate. Tmax is not a property you choose; it falls out as ln(ka/ke)/(ka−ke). The shaded area is AUC, the exposure the body actually sees.
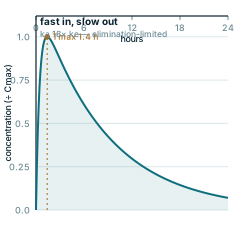
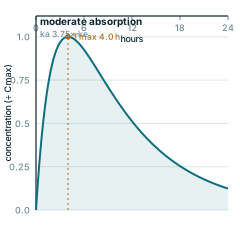
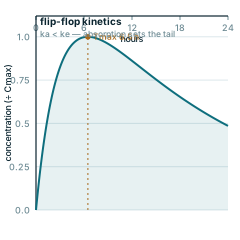
Every panel is redrawn from its own equation by scripts/glossary-figures.js — no traced or stock artwork, and a rebuild is byte-identical.