Pharmacokinetics & Dosing Concepts
Exposure-Response Relationship
An exposure-response relationship links a measure of drug exposure, rather than the administered dose, to the size of an effect or the frequency of an adverse event.
Exposure-response analysis puts a pharmacokinetic quantity on the horizontal axis instead of a dose. Average concentration, area under the curve, trough or peak may be used depending on what drives the effect. The curve is usually saturating, rising steeply over a concentration range and then flattening as the target is fully engaged. Its advantage over a plain dose-response analysis is that it removes the variability sitting between dose and blood concentration.
Regulators lean on this heavily. Exposure-response analysis is a routine part of justifying a marketed dose, and it is often the only evidence supporting dosing in subgroups too small to have their own trial. The obesity incretin programmes show the characteristic shape well: across the semaglutide trials the higher weekly maintenance amount produced greater weight loss than the lower one, while gastrointestinal adverse events also became more frequent with increasing exposure. Two curves, efficacy and tolerability, both rising, and the registered dose sits where the distance between them is judged largest.
That pairing is what makes the analysis decision-relevant. Where the efficacy curve has flattened and the adverse-event curve has not, additional exposure is pure cost. Where efficacy is still climbing, a higher dose is defensible if tolerability permits.
The interpretive trap is causal. Exposure-response relationships assembled from within-trial observation are confounded, because the people with the highest exposure often differ systematically, being lighter, having lower clearance, or being more adherent, and adherence alone can generate an apparent relationship in a placebo arm. A positive association therefore does not establish that raising an individual's exposure would raise their response. Only randomised comparison of doses settles that.
Worked examples — absorption shapes
All three solve the Bateman function, C(t) ∝ e^(−ke·t) − e^(−ka·t), and differ only in the ratio of absorption to elimination rate. Tmax is not a property you choose; it falls out as ln(ka/ke)/(ka−ke). The shaded area is AUC, the exposure the body actually sees.
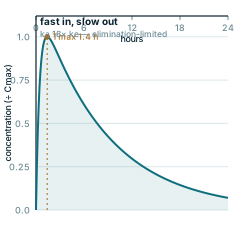
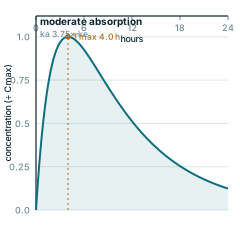
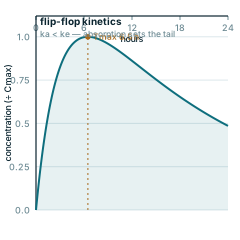
Every panel is redrawn from its own equation by scripts/glossary-figures.js — no traced or stock artwork, and a rebuild is byte-identical.