Pharmacokinetics & Dosing Concepts
PK/PD Relationship
The PK/PD relationship links the concentration-time course of a drug to the size and timing of its effect, turning exposure into a prediction about response rather than an assumption.
Pharmacokinetics describes what the body does to a drug and pharmacodynamics what the drug does to the body; the PK/PD relationship is the model joining them. Its usual core is a concentration-effect curve of the Emax form, effect rising toward a maximum as concentration climbs past the half-maximal value. When effect lags concentration, a hypothetical effect compartment is added, and a plot of effect against plasma concentration traces a loop rather than a line.
With peptides the lag is often enormous. A single growth hormone injection clears from plasma within hours, but IGF-1 rises over the following day and stays elevated for several days, so plasma growth hormone at any moment says little about effect. With GLP-1 receptor agonists, glycated haemoglobin responds over months because it reflects roughly the preceding three months of glycaemia, and body weight in the STEP and SURMOUNT programmes was still falling at a year.
The relationship is what lets a sponsor choose a phase 3 dose from phase 2 exposure data, predict a regimen never actually tested, and justify a dosing interval on something other than convenience. It also marks the limit of what exposure data can prove: matching concentrations between two products supports matching effect only when the concentration-effect link is the same for both.
The error to watch for is inferring duration of action from half-life, which the growth hormone case refutes outright. The other is the in-vitro potency claim. A compound with an impressive nanomolar EC50 in a cell assay has no clinical meaning unless achievable plasma concentrations, corrected for protein binding, approach that value, and for many research peptides they never do.
Worked examples — absorption shapes
All three solve the Bateman function, C(t) ∝ e^(−ke·t) − e^(−ka·t), and differ only in the ratio of absorption to elimination rate. Tmax is not a property you choose; it falls out as ln(ka/ke)/(ka−ke). The shaded area is AUC, the exposure the body actually sees.
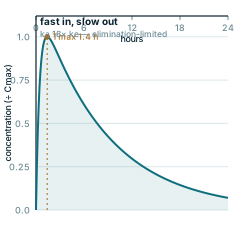
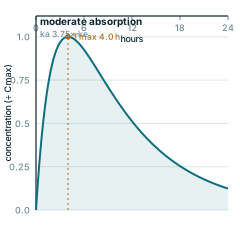
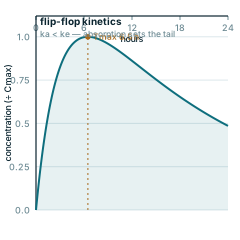
Every panel is redrawn from its own equation by scripts/glossary-figures.js — no traced or stock artwork, and a rebuild is byte-identical.