Pharmacokinetics & Dosing Concepts
Drug Clearance (CL)
Clearance is the volume of plasma completely cleared of drug per unit time, the parameter that determines steady-state exposure for any given dosing rate.
Clearance is a volume per unit time, not an amount per unit time, and that distinction carries the whole concept. It expresses the body's capacity to remove drug as the volume of plasma irreversibly stripped of it each minute, so the actual mass removed rises and falls with concentration while the capacity stays constant. It is calculated from an intravenous dose divided by total exposure, and it relates to the familiar constants by the identity that clearance equals the elimination rate constant multiplied by the volume of distribution. Organ clearances add: renal plus hepatic plus everything else.
For peptides the dominant contributions are proteolysis distributed throughout the body and renal filtration. Molecules below roughly five kilodaltons pass the glomerulus freely and are broken down at the proximal tubule brush border, so filtration sets a practical ceiling on how slowly a small peptide can be cleared. Escaping that ceiling requires becoming effectively larger, which is what albumin binding through a fatty acid chain, PEGylation and fusion to an antibody fragment all accomplish.
Clearance, not half-life, is the parameter to reason with when thinking about exposure. Average steady-state concentration is the bioavailable dosing rate divided by clearance, and nothing else enters it.
That derivation is where the common inference fails. A long half-life is routinely read as low clearance, but a drug that distributes extensively has a long half-life at perfectly ordinary clearance. The other pitfall is apparent clearance, the figure reported when no intravenous arm exists: it is clearance divided by bioavailability, so two subcutaneous studies with different absorption cannot be compared on it, and a low apparent clearance may only mean good absorption.
Worked examples — first-order elimination
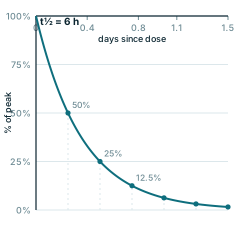
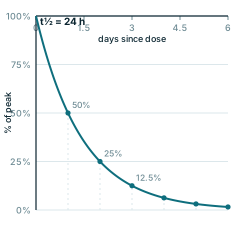
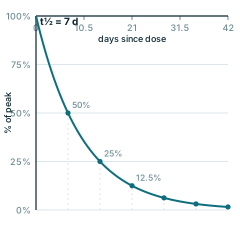
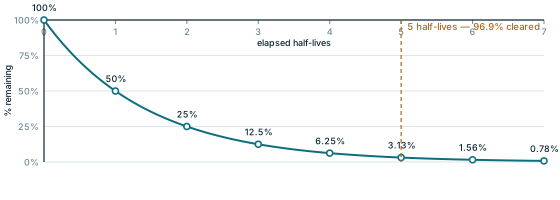
Each curve solves C(t) = C₀·e^(−kt) with k = ln2 ÷ t½. The dots mark successive half-lives, which is why the same fraction disappears in every interval regardless of where you start.
Every panel is redrawn from its own equation by scripts/glossary-figures.js — no traced or stock artwork, and a rebuild is byte-identical.