Pharmacokinetics & Dosing Concepts
Absorption Rate Constant
The absorption rate constant, ka, is the first-order rate at which drug leaves the administration site for the systemic circulation, and it governs how quickly the peak arrives.
The absorption rate constant describes how fast a drug moves from where it was administered into the bloodstream. It is expressed in reciprocal time, so an absorption half-life is ln2 divided by ka, exactly as an elimination half-life is derived from its own rate constant. Because absorption and elimination run simultaneously, the time of the peak is fixed by the ratio between them: the larger ka is relative to the elimination constant, the earlier and sharper the peak. It is a fitted parameter rather than a direct measurement, and its value depends on the model used.
Insulin analogues are the clearest demonstration that ka is engineered. Regular human insulin self-associates into hexamers in the subcutaneous depot and has to dissociate before it can be absorbed, so its peak arrives after a couple of hours; lispro and aspart carry substitutions that disfavour hexamer formation, absorb far faster, and peak inside an hour. In the opposite direction, acylated peptides absorbed slowly from a subcutaneous depot can take a day or more to peak.
Absorption rate changes the shape of the exposure curve without changing its area. Slowing ka lowers the peak and raises the trough while total exposure, which depends only on bioavailability and clearance, stays put. That is why reformulation aimed at tolerability targets absorption rate rather than dose.
The recurring error is treating a fast ka as evidence that more drug got in. Rate and extent are independent; a formulation can absorb quickly and incompletely, or slowly and completely. The second trap appears when absorption is slower than elimination: the two constants swap roles in the fitted curve, and the number labelled absorption is really describing elimination.
Worked examples — absorption shapes
All three solve the Bateman function, C(t) ∝ e^(−ke·t) − e^(−ka·t), and differ only in the ratio of absorption to elimination rate. Tmax is not a property you choose; it falls out as ln(ka/ke)/(ka−ke). The shaded area is AUC, the exposure the body actually sees.
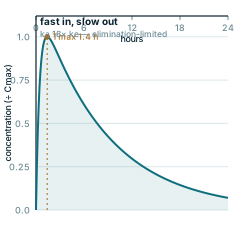
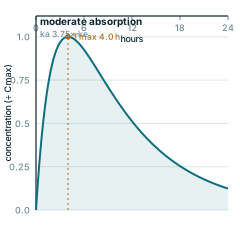
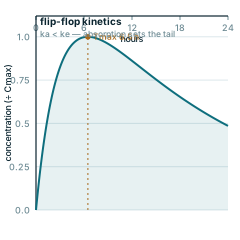
Every panel is redrawn from its own equation by scripts/glossary-figures.js — no traced or stock artwork, and a rebuild is byte-identical.