Pharmacokinetics & Dosing Concepts
Accumulation Ratio
The accumulation ratio is how much higher exposure sits at steady state than after the very first dose, and it is fixed by the dosing interval relative to the half-life.
Accumulation ratio compares exposure once repeated dosing has reached its plateau with exposure after a single dose. For a drug eliminated by a first-order process it depends on only one thing: the dosing interval expressed in half-lives. Dosing exactly one half-life apart doubles exposure at plateau. Dosing every two half-lives gives about a third more, and dosing at a third of a half-life gives roughly fivefold. The ratio is bounded, because each dose is a smaller addition to a larger residue until input and elimination balance.
The weekly incretin analogues illustrate the arithmetic. Semaglutide has a terminal half-life of roughly a week and is given weekly, so the interval is about one half-life and exposure roughly doubles between the first injection and the plateau, which it reaches after four to five weeks. Tirzepatide, with a half-life of around five days on the same weekly schedule, accumulates rather less. Liraglutide, at about thirteen hours and given daily, is dosed at nearly two half-lives and barely accumulates at all.
The number matters because it separates two things that are easy to merge. How high the plateau sits is set by the accumulation ratio; how long it takes to get there is set by the half-life alone and is unchanged by dose size or interval.
The usual misreading is that accumulation means indefinite build-up. Under first-order elimination the plateau is guaranteed, and warnings about a peptide stacking up without limit describe zero-order behaviour that these compounds do not show. The other trap is comparing accumulation ratios computed on different metrics: trough concentrations accumulate most, peaks least, and a ratio quoted without saying which one it describes is not comparable to another.
Worked examples — accumulation to steady state
Repeat doses are summed by superposition: every dose still in the body keeps decaying while the next one lands. Peak and trough have closed forms — 1/(1−e^(−kτ)) and that value times e^(−kτ) — so the plateau height is set entirely by the dosing interval relative to the half-life.
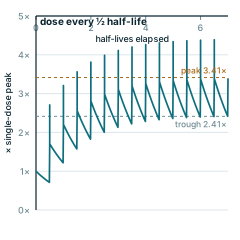
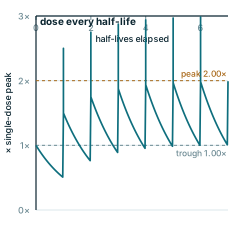
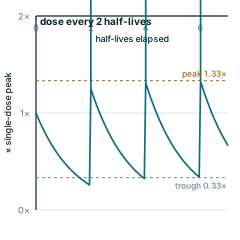
Every panel is redrawn from its own equation by scripts/glossary-figures.js — no traced or stock artwork, and a rebuild is byte-identical.