Risk Ratio (Relative Risk)
A risk ratio divides the probability of an outcome in one group by the probability in another, so 1 means no difference and the distance from 1 is the relative effect, whatever the underlying risks.
Risk is events divided by the number of people at risk, and the risk ratio divides one group's risk by another's. A value of 1 means no difference, 0.75 a quarter less and 2 a doubling; the relative risk reduction is 1 minus the ratio. Where follow-up time differs between participants the corresponding measure uses person-time denominators and is called a rate ratio or incidence rate ratio, counting events per unit of exposure rather than per person. A risk ratio cannot be computed from a case-control study, because sampling on outcome destroys the baseline risk the denominators need.
Relative and absolute measures pull apart whenever events are rare. A drop from 2 percent to 1 percent is a risk ratio of 0.5, a halving, and an absolute reduction of one percentage point, needing 100 people treated for one to benefit. A drop from 60 percent to 30 percent is the same risk ratio and a 30-point absolute difference. Nothing in the relative number distinguishes the two, which is why headlines are written in relative terms and label tables in absolute ones.
The relative effect is the more portable quantity, roughly constant across populations with different baseline risks, which is what makes it natural for meta-analyses to pool. The absolute difference answers whether an individual should bother. Both are needed, since a relative reduction without a baseline risk is uninterpretable and an absolute difference alone cannot be moved to another population.
Two confusions beyond the relative-only headline are worth naming. Odds ratios are routinely reported as relative risks, which for common outcomes overstates the effect substantially. And a risk ratio computed on a handful of events, three cases against one, carries an interval compatible with large benefit and large harm at once, yet gets quoted as a threefold increase.
Worked example — how a meta-analysis pools trials
Six trials, each with real event counts. Log risk ratios and their Katz standard errors come straight from those counts; the weight of each box is inverse-variance, so the 2,050-patient trial moves the diamond and the 88-patient trial barely does. Cochran’s Q and I² are computed from the same numbers.
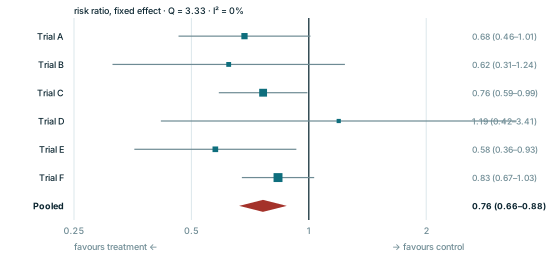
Every panel is redrawn from its own equation by scripts/glossary-figures.js — no traced or stock artwork, and a rebuild is byte-identical.