Absolute vs Relative Risk Reduction
Absolute risk reduction is the arithmetic difference between the event rates in two groups, while relative risk reduction expresses that same difference as a proportion of the control group's risk.
Both describe the same result and can differ by an order of magnitude in how large they sound. If 8 percent of a control group has an event and 6.5 percent of a treated group does, the absolute risk reduction is the subtraction, 1.5 percentage points; the relative risk reduction divides that by the control risk and returns about 19 percent. Number needed to treat is the reciprocal of the absolute reduction.
Those figures are close to SELECT, which randomised more than 17,000 adults with established cardiovascular disease and a body mass index of at least 27, without diabetes, to weekly semaglutide 2.4 mg or placebo and found major adverse cardiovascular events in 6.5 versus 8.0 percent over a mean of a little over three years. A fifth off cardiovascular risk sounds transformative; 1.5 percentage points, or roughly 67 people treated per event avoided, reads as real but modest.
Relative reductions are roughly stable across baseline risks and travel from trial to clinic reasonably well; absolute reductions scale directly with how likely the event was to begin with. The same 20 percent relative reduction is worth 4 percentage points at a 20 percent ten-year risk and 0.4 points at 2 percent, so the identical drug is worth taking in one person and arguably not in the other.
The characteristic abuse is asymmetric framing: benefits quoted relatively, harms quoted absolutely, so a product cuts events by 25 percent while raising a complication by only 0.2 percentage points. Marketing copy routinely omits the control risk, which leaves the relative figure uninterpretable, and a fall from four events to three is still reported as a 25 percent reduction.
Worked examples — the same relative risk, two different stories
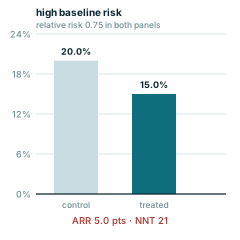
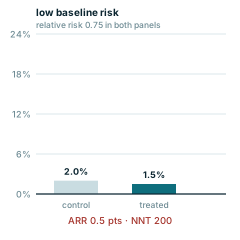
Both panels apply an identical relative risk of 0.75 — a headline "25% reduction". Only the baseline risk differs, and the absolute benefit differs seventeen-fold with it. NNT = 1 ÷ ARR is where that difference becomes visible.
Every panel is redrawn from its own equation by scripts/glossary-figures.js — no traced or stock artwork, and a rebuild is byte-identical.