Hazard Ratio (HR)
A hazard ratio compares the instantaneous rate of events between two groups among those still at risk, averaged over follow-up, and it is not a ratio of probabilities.
The hazard is the instantaneous rate of events at a given moment among people who have not yet had one and are still under observation, and the hazard ratio divides one group's hazard by the other's. Cox regression estimates it without specifying the shape of the underlying hazard over time, which is why it dominates time-to-event analysis, and it accommodates censoring, so participants who withdraw or finish the study event-free still contribute the time they were observed. Its central assumption is that the ratio stays constant across follow-up.
SELECT reported a hazard ratio of 0.80, with a 95 percent confidence interval of 0.72 to 0.90, for a composite of cardiovascular death, non-fatal myocardial infarction and non-fatal stroke with weekly semaglutide 2.4 mg. The same trial's event rates were 6.5 percent against 8.0 percent. Ratio and absolute difference come from identical data, and only the second says how many people had events.
Because it uses timing rather than only counts, a hazard ratio can distinguish delaying an event from preventing it, since two curves can converge on the same cumulative incidence while differing in hazard for years. But a hazard ratio with no event rates attached cannot be turned into anything a patient can weigh, and it is not the ratio of median survival times except under conditions that rarely hold exactly.
An HR of 0.80 read as twenty percent less likely to have an event is wrong in principle, since a rate ratio and a risk ratio converge only when events are rare. The more consequential failure is non-proportional hazards: when survival curves cross, or separate only late, the reported ratio is a weighted average whose value depends on how long follow-up ran, so the same treatment yields a different figure in a longer trial. A paper reporting a hazard ratio without ever showing the curves has withheld the check.
Worked example — how a meta-analysis pools trials
Six trials, each with real event counts. Log risk ratios and their Katz standard errors come straight from those counts; the weight of each box is inverse-variance, so the 2,050-patient trial moves the diamond and the 88-patient trial barely does. Cochran’s Q and I² are computed from the same numbers.
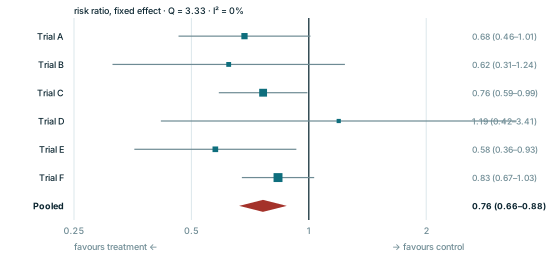
Every panel is redrawn from its own equation by scripts/glossary-figures.js — no traced or stock artwork, and a rebuild is byte-identical.