Confidence Interval (CI)
A confidence interval is the range produced by a procedure that would capture the true value in a stated percentage of repeated samples, not the probability that this particular interval contains it.
The construction is an estimate plus and minus a critical value times its standard error, which falls with the square root of sample size, so quadrupling a trial halves the width. The confidence level describes the long-run behaviour of the method, not the one interval in front of you: the true value is either inside it or not. The object supporting a 95 percent probability statement is a Bayesian credible interval, which needs a prior; the range containing 95 percent of patients is a prediction interval, much wider.
For ratio measures the interval is computed on the log scale and transformed back, so it sits asymmetrically around the estimate: SELECT reported a hazard ratio of 0.80 with a 95 percent interval of 0.72 to 0.90. A ratio interval excluding 1, or a difference interval excluding 0, corresponds to a two-sided p below 0.05 against that null, but names the whole range of effects the data are compatible with.
That interval rules out no effect and equally rules out anything better than a 28 percent reduction, which is why both bounds repay reading against the smallest difference that would matter. A significant result whose lower bound sits under the minimal clinically important difference is compatible with a benefit nobody would notice, and an interval spanning meaningful benefit and meaningful harm is not a negative result but an uninformative one.
Two errors recur. One is comparing two intervals for overlap instead of testing the difference, when two 95 percent intervals can overlap while the difference between the estimates is significant. The other is forgetting that the stated coverage assumes the model and design are right: it accounts for sampling error alone, not confounding or selective reporting, so an observational interval is always narrower than the real uncertainty.
Worked example — what sample size buys
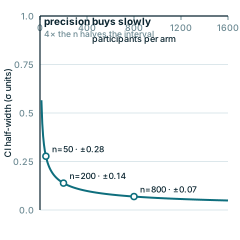
The 95% interval half-width is 1.96·σ/√n. Because n sits under a square root, precision is bought slowly: going from 50 to 200 participants per arm halves the interval, and you need 800 to halve it again.
Every panel is redrawn from its own equation by scripts/glossary-figures.js — no traced or stock artwork, and a rebuild is byte-identical.