Minimal Clinically Important Difference (MCID)
The MCID is the smallest change in an outcome measure that patients perceive as beneficial or that would alter management, and it is the benchmark a statistically significant result has to clear.
It marks a threshold below which a difference on the outcome scale can be real, reproducible and still not worth having. Anchor-based methods derive it by linking change on the instrument to an external judgement, usually a patient global rating of change, and taking the mean change among those reporting a small but definite improvement. Distribution-based methods instead use a fraction of the standard deviation or a multiple of the standard error of measurement; only the anchor-based family addresses importance, while the other describes measurement noise.
Obesity trials use a categorical responder threshold of 5 percent body weight loss, the point at which cardiometabolic risk factors begin to improve measurably, and regulators expect responder analyses at 5 and 10 percent alongside the mean change. For pain, the values usually cited are around two points on an eleven-point numeric rating scale, or a reduction of roughly thirty percent, though published estimates for one scale vary widely with population and derivation method.
The threshold turns a p-value into a judgement. A trial can report a difference whose whole confidence interval lies below the MCID: a real effect nobody would notice. Trials should be powered to detect the MCID rather than something smaller, and the threshold does most of its work on the interval's lower bound, which if it reaches below leaves open a difference too small to matter.
The persistent error is treating the MCID as a fixed property of the instrument. It shifts with baseline severity, because patients who start worse need a larger change to notice one, with the direction of change, and with the derivation method, so published values for one questionnaire can differ several-fold. The other is reading a group mean above the threshold as most patients having improved, when the mean can clear it while half the group did not.
Worked examples — the same relative risk, two different stories
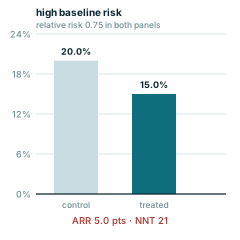
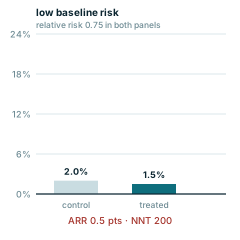
Both panels apply an identical relative risk of 0.75 — a headline "25% reduction". Only the baseline risk differs, and the absolute benefit differs seventeen-fold with it. NNT = 1 ÷ ARR is where that difference becomes visible.
Every panel is redrawn from its own equation by scripts/glossary-figures.js — no traced or stock artwork, and a rebuild is byte-identical.