P-Value
A p-value is the probability of data at least as extreme as those observed if the null hypothesis and every modelling assumption were true, not the probability that the null hypothesis is true.
The p-value is computed under an assumed world in which the treatment does nothing and the study was conducted and analysed exactly as modelled, and it answers how unusual the observed data would be there. It cannot answer the question readers ask, which runs the other way and needs a prior probability to be answerable at all. It is not the probability of a fluke, not the probability the result is wrong, and not one minus the probability of replication. The 0.05 convention descends from Fisher's convenience; genome-wide association studies use 5 times ten to the minus 8.
The American Statistical Association set out these limits formally in 2016. The practical core is that a p-value carries no information about the size of an effect. With tens of thousands of participants, a difference of 0.1 percentage points in a laboratory value returns p below 0.001; with thirty participants, a genuinely large effect often returns p above 0.2.
A small p-value licenses the statement that chance alone, under the stated model, is an uncomfortable explanation of the data. It licenses nothing about how much, which belongs to the effect size, or how uncertain, which belongs to the interval. Reporting both makes the threshold largely redundant, and the interval also shows what the study has ruled out, which a non-significant p-value never does.
Three misreadings do most of the damage: treating p of 0.06 as a trend towards benefit, when the alternative to significance is not a direction; treating p below 0.001 as a big effect rather than a well-measured one; and treating a non-significant result as no difference, when an underpowered study routinely fails to detect what it never could. The difference between a significant and a non-significant result is not itself significant.
Worked example — what sample size buys
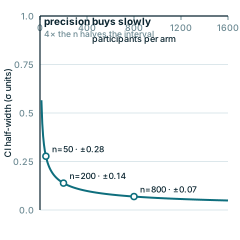
The 95% interval half-width is 1.96·σ/√n. Because n sits under a square root, precision is bought slowly: going from 50 to 200 participants per arm halves the interval, and you need 800 to halve it again.
Every panel is redrawn from its own equation by scripts/glossary-figures.js — no traced or stock artwork, and a rebuild is byte-identical.