P-Hacking
P-hacking is trying analytical variations until a result crosses the significance threshold, which invalidates the p-value because the selection step is never counted in it.
P-hacking covers every route by which the analysis reported was chosen after seeing which analysis worked: dropping outliers by a rule invented once they were visible, adding or removing covariates, switching to a related outcome, splitting a continuous variable at the cut point that separates best, or recruiting further because an interim look was not yet significant. Each is defensible alone and each enlarges the space of results that could have been reported. The garden of forking paths needs no bad faith: one analysis is run, but another would have been had the data differed.
Simmons, Nelson and Simonsohn quantified it in 2011, showing that a handful of ordinary researcher degrees of freedom, two dependent variables, an optional extra ten observations per cell, a covariate and a dropped condition, together push the false-positive rate for a nominally 5 percent test past 60 percent. They then used those same freedoms on real data to establish that listening to a particular song made people younger.
A p-value means what it claims only if the test was fixed before the data were seen, which makes the analysis plan rather than the number the object worth inspecting. That is why a prespecified analysis plan deposited in a registry is what separates confirmatory from exploratory work. Optional stopping deserves separate mention: unrestricted repeated testing eventually reaches p below 0.05 with probability approaching 1 even when the null is exactly true.
In the peptide literature the fingerprint is a small study that measured fifteen biomarkers and reports the two that moved, with no statement that either was nominated in advance and no correction for the rest. A related tell is an analysis population defined by exclusions that appear only in the results.
Worked examples — what a censored literature looks like
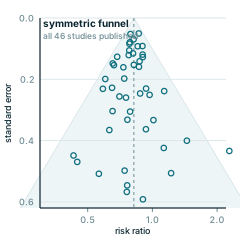
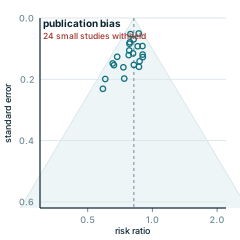
Both panels start from the same 46 simulated trials drawn at their own standard errors around a true risk ratio of 0.82. The second panel simply withholds the small studies that came out null or unfavourable — exactly what publication bias does — and the funnel goes lopsided.
Every panel is redrawn from its own equation by scripts/glossary-figures.js — no traced or stock artwork, and a rebuild is byte-identical.