Odds Ratio (OR)
An odds ratio divides the odds of an outcome in one group by the odds in another, where odds are events divided by non-events, and it exaggerates the risk ratio whenever the outcome is common.
Odds are not risk. Risk is events divided by everyone; odds are events divided by non-events, so a 20 percent risk is odds of 0.25. The odds ratio divides one group's odds by another's, which in a two-by-two table reduces to the cross-product, a times d over b times c. That algebra makes it symmetric: it is unchanged if exposure and outcome swap roles, which is why a case-control study, recruiting on outcome with baseline risk unknowable, can still estimate it. Logistic regression works in log odds, so pooling and intervals are computed on that scale and exponentiated back.
The gap from the risk ratio widens with the frequency of the outcome. At 1 percent against 0.5 percent the risk ratio is 2.00 and the odds ratio 2.01, close enough to ignore. At 60 percent against 40 percent the risk ratio is 1.5 while the odds ratio is 2.25. The rule of thumb is that the approximation holds below about 10 percent, and the divergence always runs away from 1.
So the odds ratio is the correct measure for case-control designs and the natural output of adjusted logistic models, and a poor communication device for common outcomes. It also carries an awkward property called non-collapsibility: an adjusted odds ratio does not equal the population-average odds ratio even when the covariates cause no confounding, so two adjusted odds ratios from models with different covariate sets are not comparable quantities.
The predictable failure is verbal. An odds ratio of 2.25 gets reported as risk doubled, when the risks were 60 and 40 percent and the real increase was half again. Observational supplement and peptide literature leans on odds ratios heavily, often for outcomes far too common for the approximation, and the summary sentence almost always says risk.
Worked example — how a meta-analysis pools trials
Six trials, each with real event counts. Log risk ratios and their Katz standard errors come straight from those counts; the weight of each box is inverse-variance, so the 2,050-patient trial moves the diamond and the 88-patient trial barely does. Cochran’s Q and I² are computed from the same numbers.
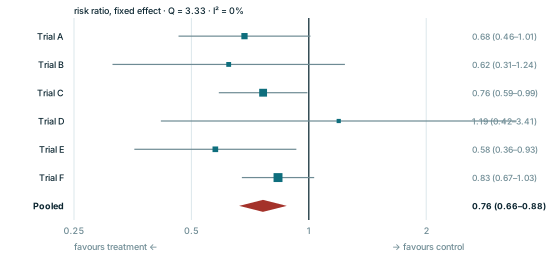
Every panel is redrawn from its own equation by scripts/glossary-figures.js — no traced or stock artwork, and a rebuild is byte-identical.