Meta-Analysis
A meta-analysis statistically combines effect estimates from several studies into a pooled estimate, weighting each by its precision, and is a method rather than a grade of evidence.
Each study contributes its estimate weighted by the inverse of its variance, so larger and more precise studies dominate. A fixed-effect model assumes one common true effect underlies every study and treats all variation as sampling error, answering what the effect was in these studies. A random-effects analysis assumes the true effect varies between studies, adds the estimated between-study variance to every weight, and estimates the mean of a distribution of effects, widening the interval and flattening the weights so small studies count for more.
Pooling can be decisively right or decisively wrong. Meta-analyses of small trials of intravenous magnesium after myocardial infarction reported a substantial mortality benefit; ISIS-4, which randomised over 58,000 patients, found none. Small trials with unremarkable results had never been published, and the pooled precision was precision about a biased number. The same machinery applied to antenatal corticosteroids extracted a clear answer from individually inconclusive studies.
What a meta-analysis buys is precision, and only precision. It cannot repair confounding, selective reporting, or an outcome definition flawed the same way in every trial; combining such studies states the resulting bias more precisely rather than removing it. Whether the pooled number is worth anything is settled by the systematic review underneath, its search, eligibility rules and risk-of-bias assessment.
The routine misuse is quoting a random-effects pooled estimate as the effect when between-study variance is large. That figure is the mean of a spread, and the prediction interval, not the confidence interval, describes what a new study would find. Two more: overlapping meta-analyses covering substantially the same trials, cited as independent confirmations, and a pooled result in which one large trial supplies most of the weight.
Worked example — how a meta-analysis pools trials
Six trials, each with real event counts. Log risk ratios and their Katz standard errors come straight from those counts; the weight of each box is inverse-variance, so the 2,050-patient trial moves the diamond and the 88-patient trial barely does. Cochran’s Q and I² are computed from the same numbers.
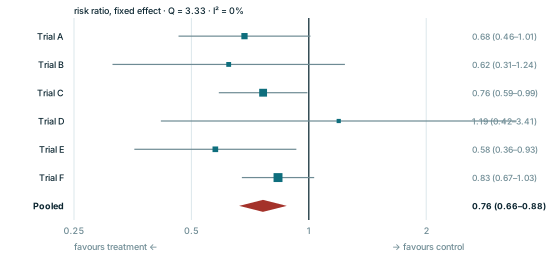
Every panel is redrawn from its own equation by scripts/glossary-figures.js — no traced or stock artwork, and a rebuild is byte-identical.