Funnel Plot
A funnel plot scatters each study's effect estimate against its precision to show whether small studies are systematically missing or systematically different from large ones.
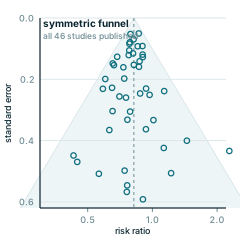
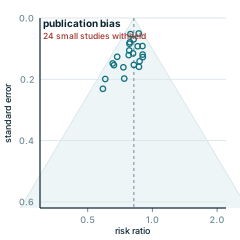
The effect estimate goes on the horizontal axis and a measure of precision on the vertical, usually the standard error inverted so the most precise studies sit at the top. If nothing but sampling error is at work the result is a symmetric inverted funnel, large studies clustered around the pooled effect and small ones spread widely below. Asymmetry, typically a hole where small studies with unremarkable results should be, is the signal, and Egger's test formalises it as a weighted regression of the effect estimate on its standard error.
This is the standard screen for publication bias, but Cochrane guidance is not to attempt it with fewer than about ten studies, because below that the tests have almost no power and asymmetry cannot be told from chance. Publication bias is also only one explanation. Genuine heterogeneity produces it if small trials enrolled higher-risk patients with more to gain, as does poorer methodological quality among small studies, and for odds ratios there is a mathematical association between the estimate and its own standard error that generates asymmetry artefactually.
Asymmetry is a reason to downgrade confidence in the pooled estimate and to go looking for the missing studies, in trial registries, conference abstracts and regulatory review documents, which routinely hold negative results that never reached a journal. What it does not do is tell you the size, or even reliably the direction, of the correction needed.
Both readings fail in practice. Symmetric funnel, therefore no publication bias, is not a finding when only eight studies were plotted. Asymmetric funnel, therefore publication bias, skips the alternatives, and reporting a trim-and-fill adjusted estimate as though it were a measurement compounds the error, since trim-and-fill imputes studies that were never run under an assumption it cannot check.
Worked examples — what a censored literature looks like
Both panels start from the same 46 simulated trials drawn at their own standard errors around a true risk ratio of 0.82. The second panel simply withholds the small studies that came out null or unfavourable — exactly what publication bias does — and the funnel goes lopsided.
Every panel is redrawn from its own equation by scripts/glossary-figures.js — no traced or stock artwork, and a rebuild is byte-identical.