Heterogeneity (I²)
Heterogeneity is variation in the true effects across studies in a meta-analysis, and I-squared estimates the share of observed variation that exceeds what sampling error alone would produce.
There are two kinds. Clinical and methodological heterogeneity is variation in populations, doses, comparators, instruments and follow-up length, judged by reading the studies rather than by computing anything. Statistical heterogeneity is variation among the estimates larger than sampling error explains. Cochran's Q is the weighted sum of squared deviations of each study's estimate from the pooled one; I-squared rescales Q as a percentage, Q minus its degrees of freedom divided by Q, floored at zero. Tau-squared is the estimated variance of the true effects.
Cochrane offers deliberately overlapping bands rather than thresholds: zero to forty percent possibly unimportant, thirty to sixty moderate, fifty to ninety substantial, seventy-five upward considerable. I-squared is a ratio, not a magnitude. Pool several very large trials and sampling error is tiny, so a clinically negligible difference produces a high I-squared; pool a handful of small ones and real, important differences can produce an I-squared of zero.
High heterogeneity is a prompt to explain rather than to abandon. Subgroup analysis, meta-regression on dose or duration and restriction to one instrument all attempt this, though such comparisons are observational across studies. It also argues for a prediction interval, which uses tau-squared to say where the effect in a new setting would plausibly fall and is far wider than the interval around the pooled mean.
The everyday misuse is an I-squared of zero from four small trials, quoted as evidence that they agree; Q has very low power with few studies, so a non-significant Q is weak reassurance rather than a demonstration of consistency. The reverse error is discarding a review because I-squared was eighty percent, when trials that all point the same way and differ only in magnitude are not in the same situation as trials pointing opposite ways.
Worked example — how a meta-analysis pools trials
Six trials, each with real event counts. Log risk ratios and their Katz standard errors come straight from those counts; the weight of each box is inverse-variance, so the 2,050-patient trial moves the diamond and the 88-patient trial barely does. Cochran’s Q and I² are computed from the same numbers.
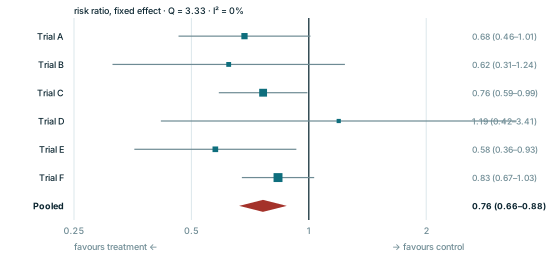
Every panel is redrawn from its own equation by scripts/glossary-figures.js — no traced or stock artwork, and a rebuild is byte-identical.