Number Needed to Treat (NNT)
Number needed to treat is the number of people who must receive a treatment for one additional person to benefit, the reciprocal of the absolute risk reduction over a stated period.
Number needed to treat converts an absolute risk reduction into people. Subtract the treated group's event rate from the control group's and invert the difference: 10 percent against 5 percent gives an absolute reduction of 5 percentage points and an NNT of 20, rounded up where division is untidy. The number is tied to a follow-up duration, an outcome definition and a baseline risk, and changing any of the three changes the answer. It does not identify which 20 people.
SELECT supplies a worked example on a hard outcome. Weekly semaglutide 2.4 mg against placebo, in adults with established cardiovascular disease and overweight or obesity but without diabetes, produced major adverse cardiovascular events in about 6.5 percent versus about 8.0 percent over roughly three years. The absolute difference is near 1.5 percentage points, so the NNT sits in the high sixties, while the relative reduction of about 20 percent supplied the headlines.
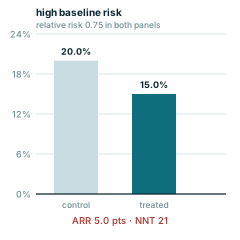
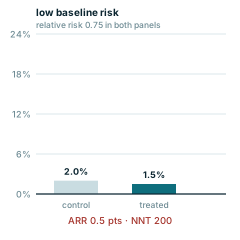
Because NNT inverts an absolute difference, it inherits the dependence on baseline risk that relative measures shed. The same relative reduction in a population with a tenth of the event rate produces an NNT ten times larger, which is the whole argument between treating everyone and treating the high-risk. That is what makes it the right currency for a decision, putting benefit on the same scale as the harms and cost a patient would also accept.
The recurring abuse is an NNT quoted with no time horizon, which lets a three-year benefit read as an annual one. Close behind is an NNT calculated on a surrogate: reaching a weight-loss threshold is not an averted event, and the two figures are not interchangeable. Applying a published NNT to another population is the third, since it assumes that population's untreated risk matches the trial's.
Worked examples — the same relative risk, two different stories
Both panels apply an identical relative risk of 0.75 — a headline "25% reduction". Only the baseline risk differs, and the absolute benefit differs seventeen-fold with it. NNT = 1 ÷ ARR is where that difference becomes visible.
Every panel is redrawn from its own equation by scripts/glossary-figures.js — no traced or stock artwork, and a rebuild is byte-identical.