Pharmacokinetics & Dosing Concepts
Maintenance Dose
The maintenance dose is the amount per dosing interval that replaces what the body clears, holding average concentration at steady state, and it is set by clearance rather than by distribution.
A maintenance dose is the input that balances output. At steady state the amount entering the circulation over a dosing interval equals the amount eliminated, so the required rate is the target average concentration multiplied by clearance and divided by bioavailability. Half-life fixes how often you dose; clearance fixes how much. Those are separate questions, and conflating them is how regimens end up the right size at the wrong spacing.
Approved incretin agents show the pattern as reported trial facts. Semaglutide for type 2 diabetes was studied at 1.0 and 2.0 mg once weekly in the SUSTAIN programme and at 2.4 mg once weekly for weight management in STEP 1; tirzepatide was studied at 5, 10 and 15 mg once weekly in SURMOUNT-1. Each was reached by escalation, and each weekly amount is a maintenance rate matched to a roughly week-long half-life.
Because the number derives from clearance, whatever changes clearance changes it: renal or hepatic impairment for drugs eliminated by those organs, a formulation change that alters bioavailability, a switch of route. It is also where exposure-response evidence has to be read. If the response curve has already flattened, a larger maintenance dose buys adverse effects and little else.
The frequent error is treating the highest approved maintenance dose as the effective dose and everything below it as underdosing. Trials of these agents report substantial response at lower maintained levels, with the top of the range adding less than the step in milligrams suggests. The mirror error is assuming a maintenance dose transfers between products of the same class, when clearance and potency both differ.
Worked examples — accumulation to steady state
Repeat doses are summed by superposition: every dose still in the body keeps decaying while the next one lands. Peak and trough have closed forms — 1/(1−e^(−kτ)) and that value times e^(−kτ) — so the plateau height is set entirely by the dosing interval relative to the half-life.
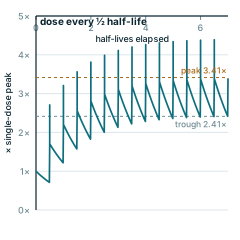
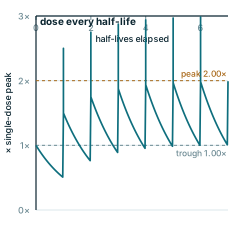
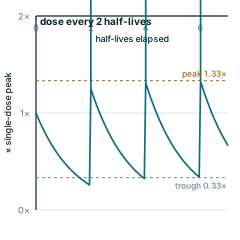
Every panel is redrawn from its own equation by scripts/glossary-figures.js — no traced or stock artwork, and a rebuild is byte-identical.