Pharmacokinetics & Dosing Concepts
Dose Titration
Dose titration is the stepwise adjustment of a dose over time toward a target amount or a measured response, rather than starting at the intended maintenance level.
Titration means approaching a destination dose in stages. Two logics drive it and they are worth keeping apart. Tolerability-driven titration exists because some adverse effects respond to the change in exposure rather than its absolute level and attenuate with continued exposure, so arriving slowly allows adaptation. Response-driven titration instead adjusts against a measured endpoint, as insulin dosing is adjusted against glucose, and has no fixed destination at all. A third consideration is kinetic: with a long half-life, each step needs several weeks before its full effect is visible.
The incretin programmes are built around the first logic. The STEP 1 trial escalated semaglutide over sixteen weeks before holding participants at the maintenance amount for the remainder of its sixty-eight weeks, and the SURMOUNT-1 tirzepatide programme used four-week steps in a similar structure. The reason is well documented in those datasets: nausea, vomiting and other gastrointestinal events cluster around dose increases and subside on a stable amount.
Titration changes what a trial result means. Efficacy at a target dose is observed only among those who reached it, so a slow escalation both improves retention and makes the top-dose population a selected one. It also makes short-horizon comparisons across programmes unreliable, since a twelve-week readout may catch one compound at maintenance and another still climbing.
Where this goes wrong outside the clinic is the treatment of a published escalation ladder as a transferable instruction. A schedule is derived from one product's tolerability data at one formulation, potency and half-life; copying its shape onto an unapproved analogue with different kinetics has no evidential basis whatever.
Worked examples — accumulation to steady state
Repeat doses are summed by superposition: every dose still in the body keeps decaying while the next one lands. Peak and trough have closed forms — 1/(1−e^(−kτ)) and that value times e^(−kτ) — so the plateau height is set entirely by the dosing interval relative to the half-life.
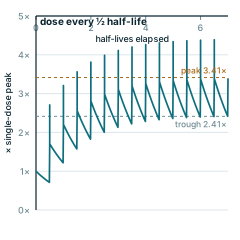
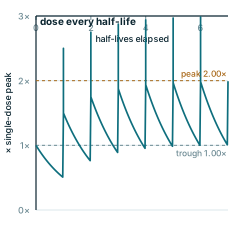
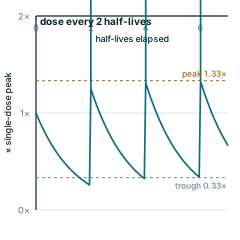
Every panel is redrawn from its own equation by scripts/glossary-figures.js — no traced or stock artwork, and a rebuild is byte-identical.