GRADE Certainty of Evidence
GRADE rates the certainty of evidence for each outcome as high, moderate, low or very low, separately from the size of the effect and from the strength of any recommendation built on it.
GRADE, the Grading of Recommendations Assessment, Development and Evaluation approach, rates a body of evidence one outcome at a time rather than rating studies. Randomised trials enter at high certainty and can be downgraded across five domains: risk of bias, inconsistency, indirectness of population, intervention, comparator or outcome, imprecision, and suspected publication bias. Observational studies enter at low certainty and can be upgraded for a very large effect, a dose-response gradient, or where plausible confounding would have pushed the estimate towards the null.
It underpins World Health Organization guidelines, Cochrane summary-of-findings tables and many national guideline programmes. Because the rating attaches to an outcome, one review routinely reports high certainty for weight change and low certainty for a rare harm drawn from the same trials, which were powered for the first and not the second.
Certainty describes how likely further research is to change the estimate, not how large or favourable the estimate is. GRADE separates it from recommendation strength, so a strong recommendation can rest on low-certainty evidence when every alternative is worse, and high-certainty evidence of a trivial effect supports at most a conditional one. The useful output is the stated reason for each downgrade, since imprecision is fixed by a larger trial while indirectness is not.
Low certainty gets read as shown not to work. It means the true effect may differ substantially from the estimate, in either direction. The opposite error is commoner in promotional writing, where the bare existence of a randomised trial is offered as though the evidence were high certainty; a single thirty-person open-label trial with a surrogate outcome would be downgraded for risk of bias, imprecision and indirectness before anyone finished rating it.
Worked examples — what a censored literature looks like
Both panels start from the same 46 simulated trials drawn at their own standard errors around a true risk ratio of 0.82. The second panel simply withholds the small studies that came out null or unfavourable — exactly what publication bias does — and the funnel goes lopsided.
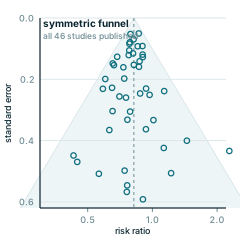
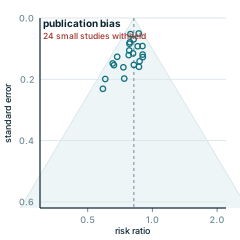
Every panel is redrawn from its own equation by scripts/glossary-figures.js — no traced or stock artwork, and a rebuild is byte-identical.