Pharmacokinetics & Dosing Concepts
Zero-Order Elimination
Zero-order elimination removes a constant amount of drug per unit time rather than a constant fraction, which happens once the enzymes or receptors doing the work become saturated.
Under first-order elimination a fixed proportion of what is present disappears per unit time; under zero-order a fixed quantity does, however much is there. The transition is described by Michaelis-Menten kinetics, where elimination rate equals a maximum velocity multiplied by concentration and divided by the sum of concentration and the half-saturation constant. Well below saturation the process looks first order; well above it, rate stops responding to concentration and half-life is no longer constant at all.
Ethanol is the textbook case, cleared at roughly a fixed amount per hour once alcohol dehydrogenase saturates, and phenytoin the clinically dangerous one, where a small dose increase near saturation produces a disproportionate rise in concentration. Therapeutic peptides seldom saturate their degradation, because peptidase capacity is enormous relative to the amounts administered. What they do show is target-mediated disposition, where clearance by receptor binding and internalisation saturates as dose rises.
The practical question is whether exposure scales with dose, which is why dose-proportionality studies exist. Where it does not, no single factor converts dose into exposure, extrapolation from one dose level to another fails, and the gap between a tolerated dose and a harmful one narrows in a way the milligram figures conceal. Accumulation predictions built on a constant half-life stop working as well.
The commonest error is assuming linearity because only one dose level was ever studied; nonlinearity stays invisible until levels are compared. The subtler one confuses two opposite patterns. Phenytoin-type saturation is well behaved at low concentrations and disproportionate at high ones, whereas target-mediated clearance is the reverse, more than proportional at low doses and proportional once receptors are occupied.
Worked examples — first-order elimination
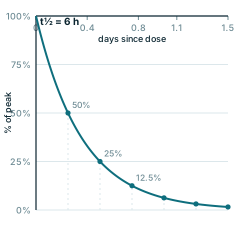
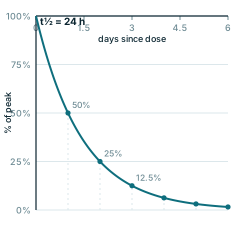
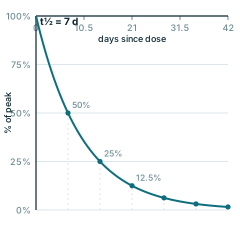
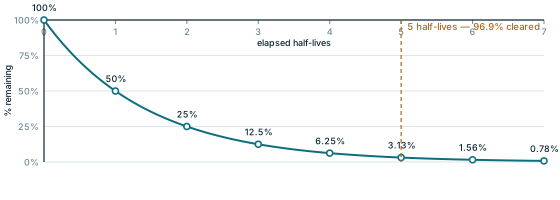
Each curve solves C(t) = C₀·e^(−kt) with k = ln2 ÷ t½. The dots mark successive half-lives, which is why the same fraction disappears in every interval regardless of where you start.
Every panel is redrawn from its own equation by scripts/glossary-figures.js — no traced or stock artwork, and a rebuild is byte-identical.